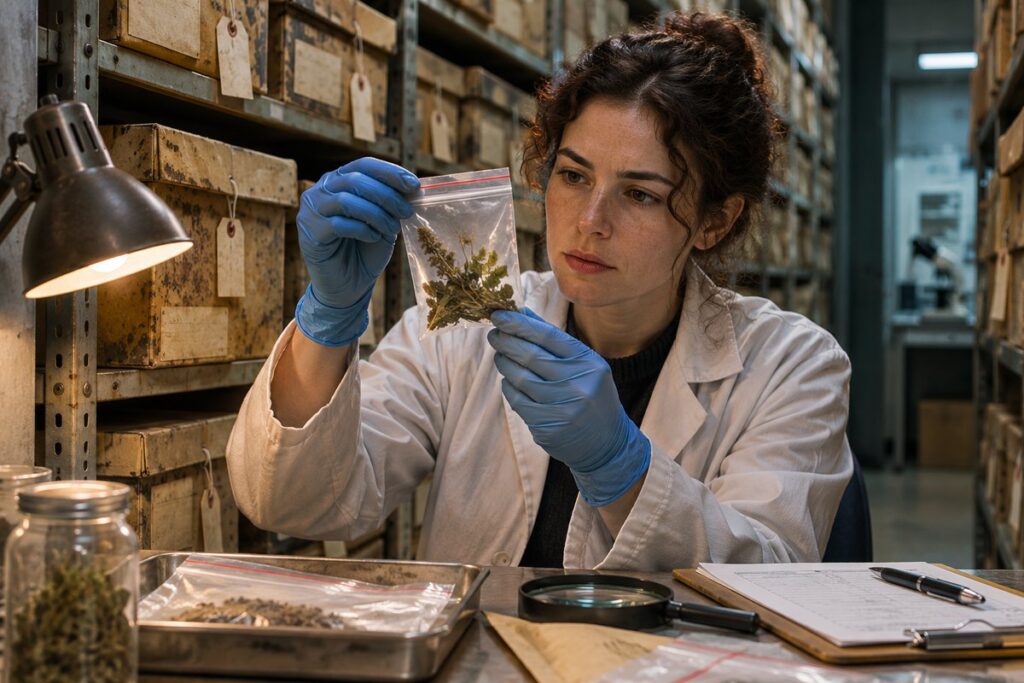
A confiscated bag of cannabis can sit behind a statistic for decades. Long after the individual case has faded from view, a laboratory result still records the proportion of THC in the material that arrived for testing. Place thousands of those results in chronological order and a historical pattern appears. In one US series, the average for cannabis plant material rose from roughly 4 percent THC in 1995 to 12 percent in 2014. How closely does that line follow what people were actually buying?
How a specimen joined the series
In the study by Mahmoud ElSohly and colleagues, researchers analyzed 38,681 confiscated cannabis preparations received over twenty years. A laboratory with a long-running testing program offers something that old advertisements and people’s memories cannot supply: direct chemical measurements on material from the period. And because the paper distinguishes types of preparation, readers can look beneath the overall average.
Entry into the archive depended on several events, beginning with a seizure. Material then had to be submitted for analysis. A specimen represents the sample tested, even when it came from a much larger seizure. Counting every specimen once therefore gives a different average from weighting each one by the weight confiscated. Neither average automatically gives the concentration encountered by a typical consumer. That would require information about the products that reached consumers and the quantities they acquired.
The mix inside a rising average
The researchers separated ordinary herbal material from sinsemilla, the seedless flowering material generally associated with higher THC concentrations. The mix changed over time. In the later years, the authors observed fewer submissions in the ordinary marijuana category and more sinsemilla samples. A change in that balance alone can lift the overall mean, even before one considers whether concentrations changed within either category.
A miniature example shows how. Suppose a collection holds equal numbers of two sample types averaging 4 and 12 percent THC. The combined mean is 8 percent. Now let the stronger type account for three quarters of the collection, holding the concentration of both types steady. The mean rises to 10 percent. Nothing in this arithmetic says that the US trend was purely a change in mix. It shows why a statistical history needs separate figures for the categories as well as a line for the whole archive.
That distinction matters to the story a journalist might tell. More frequent access to high-potency material is a meaningful change in a market. Increasing THC within material of a given type is another. A headline about stronger cannabis can refer to either process, or to both at once. Separate trends for flower and resin also help prevent a change in the popularity of a preparation from being misread as a change in its chemistry.
Checking the story against other archives
An international systematic review brought together studies from seven countries covering different parts of the period from 1970 to 2017. It found increases in THC for herbal cannabis and for resin. A European analysis covering 2006 to 2016 also considered herbal cannabis and resin separately. Agreement across collections increases confidence in the broad direction of change, although the underlying sampling practices still affect the size of the estimates.
A very different archive became available in Washington State: records of roughly thirty million retail cannabis sales. Those records connect potency information with transactions in a particular legal market. They answer questions about purchases that confiscated specimens cannot, while overlooking transactions outside the licensed system. Nor do they tell us retrospectively what was most often bought nationwide in 1995.
The oldest bag in a seizure archive never had to represent an entire generation. Its contribution was narrower and more durable: a measured concentration, attached to a date and a type of material. The broad rise in THC is easier to trust when its history preserves those details, including the particular route the specimens took to the laboratory.